New chart on economic growth, power & energy consumption, GHG emissions 1990 - 2016
Clean Energy Wire
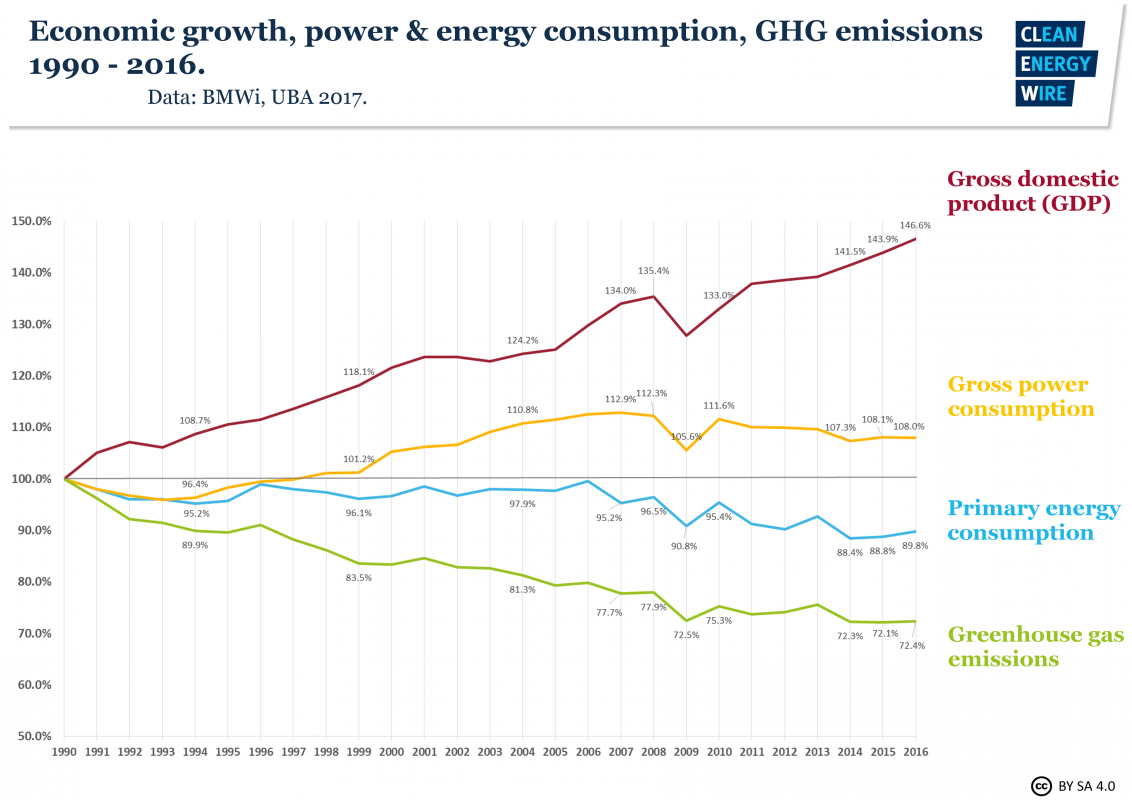
The Clean Energy Wire has added a chart showing the development of economic growth, power and energy consumption, and GHG emissions from 1990 – 2016 to its factsheet on Germany’s energy consumption and power mix.
Check out the CLEW factsheet Germany’s energy consumption and power mix in charts.
All texts created by the Clean Energy Wire are available under a
“Creative Commons Attribution 4.0 International Licence (CC BY 4.0)”
.
They can be copied, shared and made publicly accessible by users so long as they give appropriate credit, provide a
link to the license, and indicate if changes were made.