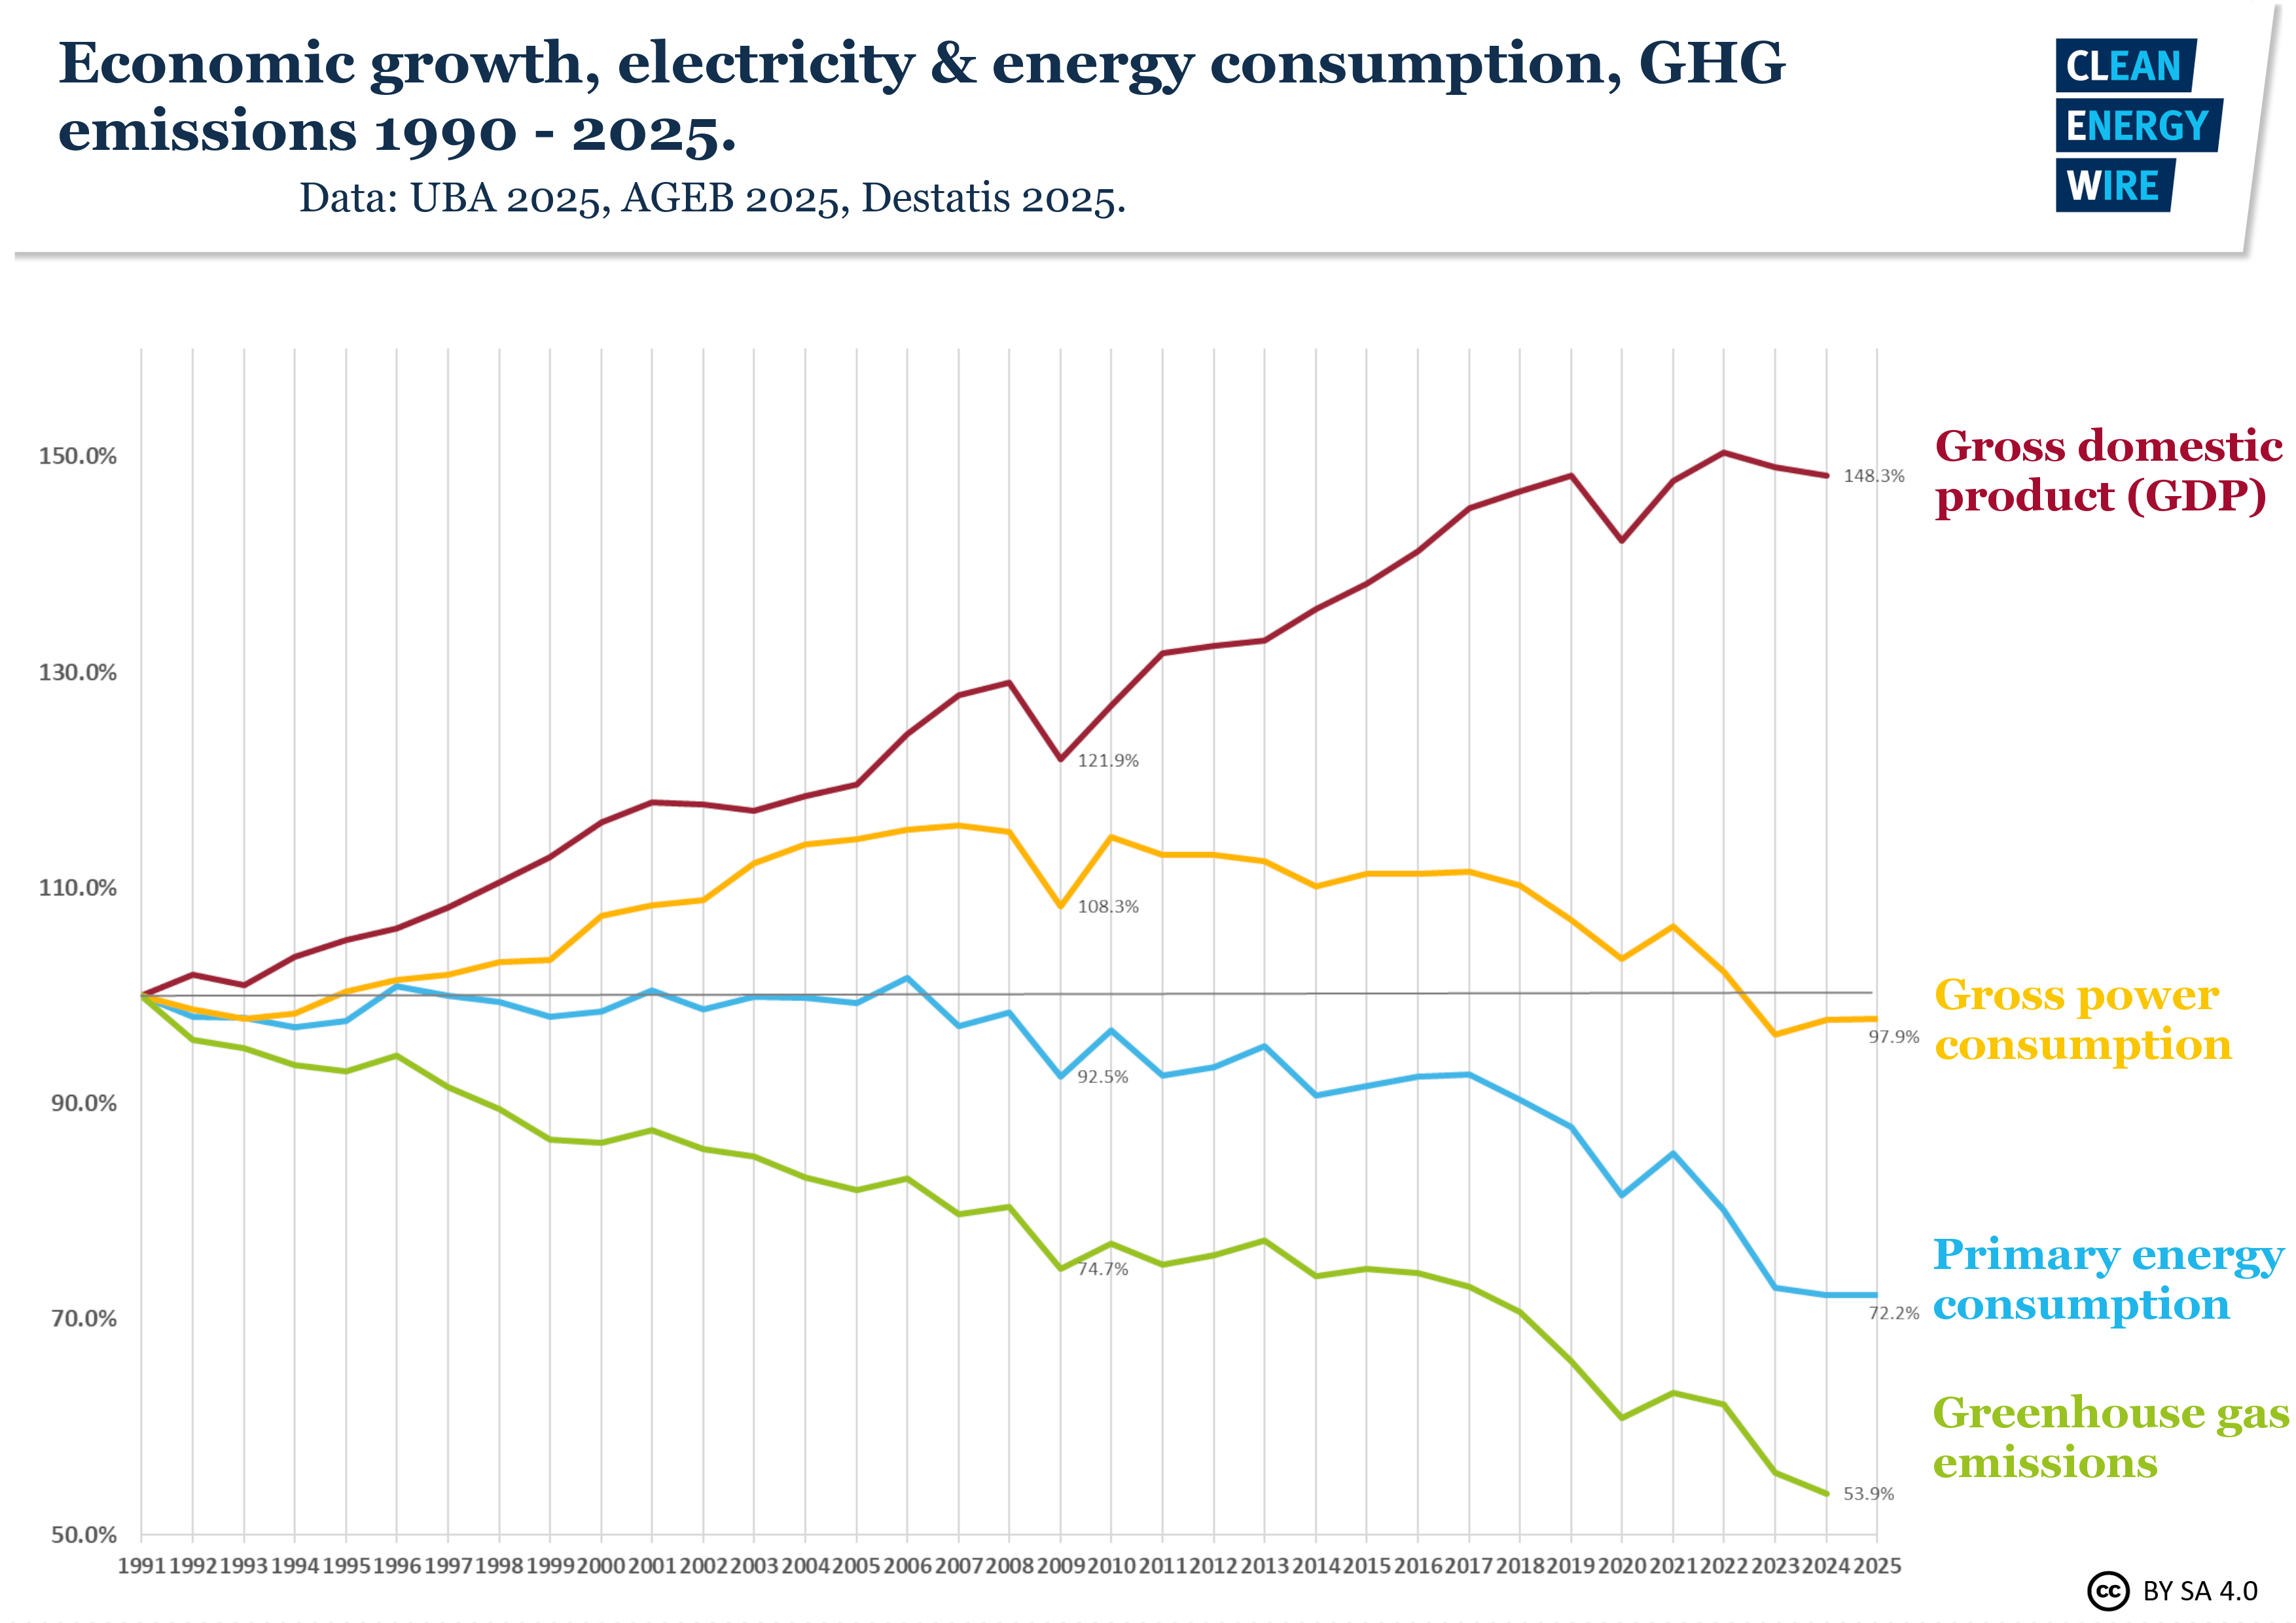
Germany’s energy consumption and power mix in charts

A wealth of numbers and statistics describe the energy generation and consumption of nation states. This factsheet provides a range of charts (and data links) about the status of Germany’s energy mix, as well as developments in energy and power production and usage since 1990. [UPDATES several graphs with preliminary 2023 data]

Economic growth

Graph shows economic growth in Germany, while emissions and energy consumption fall 1990-2022. Source: CLEW 2023.

Link to source here, and here.


Power production

Graph shows installed net power generation capacity in Germany 2002-2023. Graph: CLEW 2023.
Graph shows gross power production in Germany 1990-2023, by source. Graph: CLEW 2023.
Graph shows share of energy sources in gross German power production in 2023. Graph: CLEW 2023.

Link to source.


Power consumption

Graph shows Germany's net power consumption by consumer group 2000-2022. Graph: CLEW 2023.
Graph shows renewables share in gross power consumption 1990-2023. Graph: CLEW 2023.
Graph shows share of electricity from renewable sources in gross electricity consumption in European countries in 2021. Graph: CLEW 2023.

Link to source.


Germany's power export

Graph shows German power production and consumption and export balance 1990-2023. Graph: CLEW 2023.

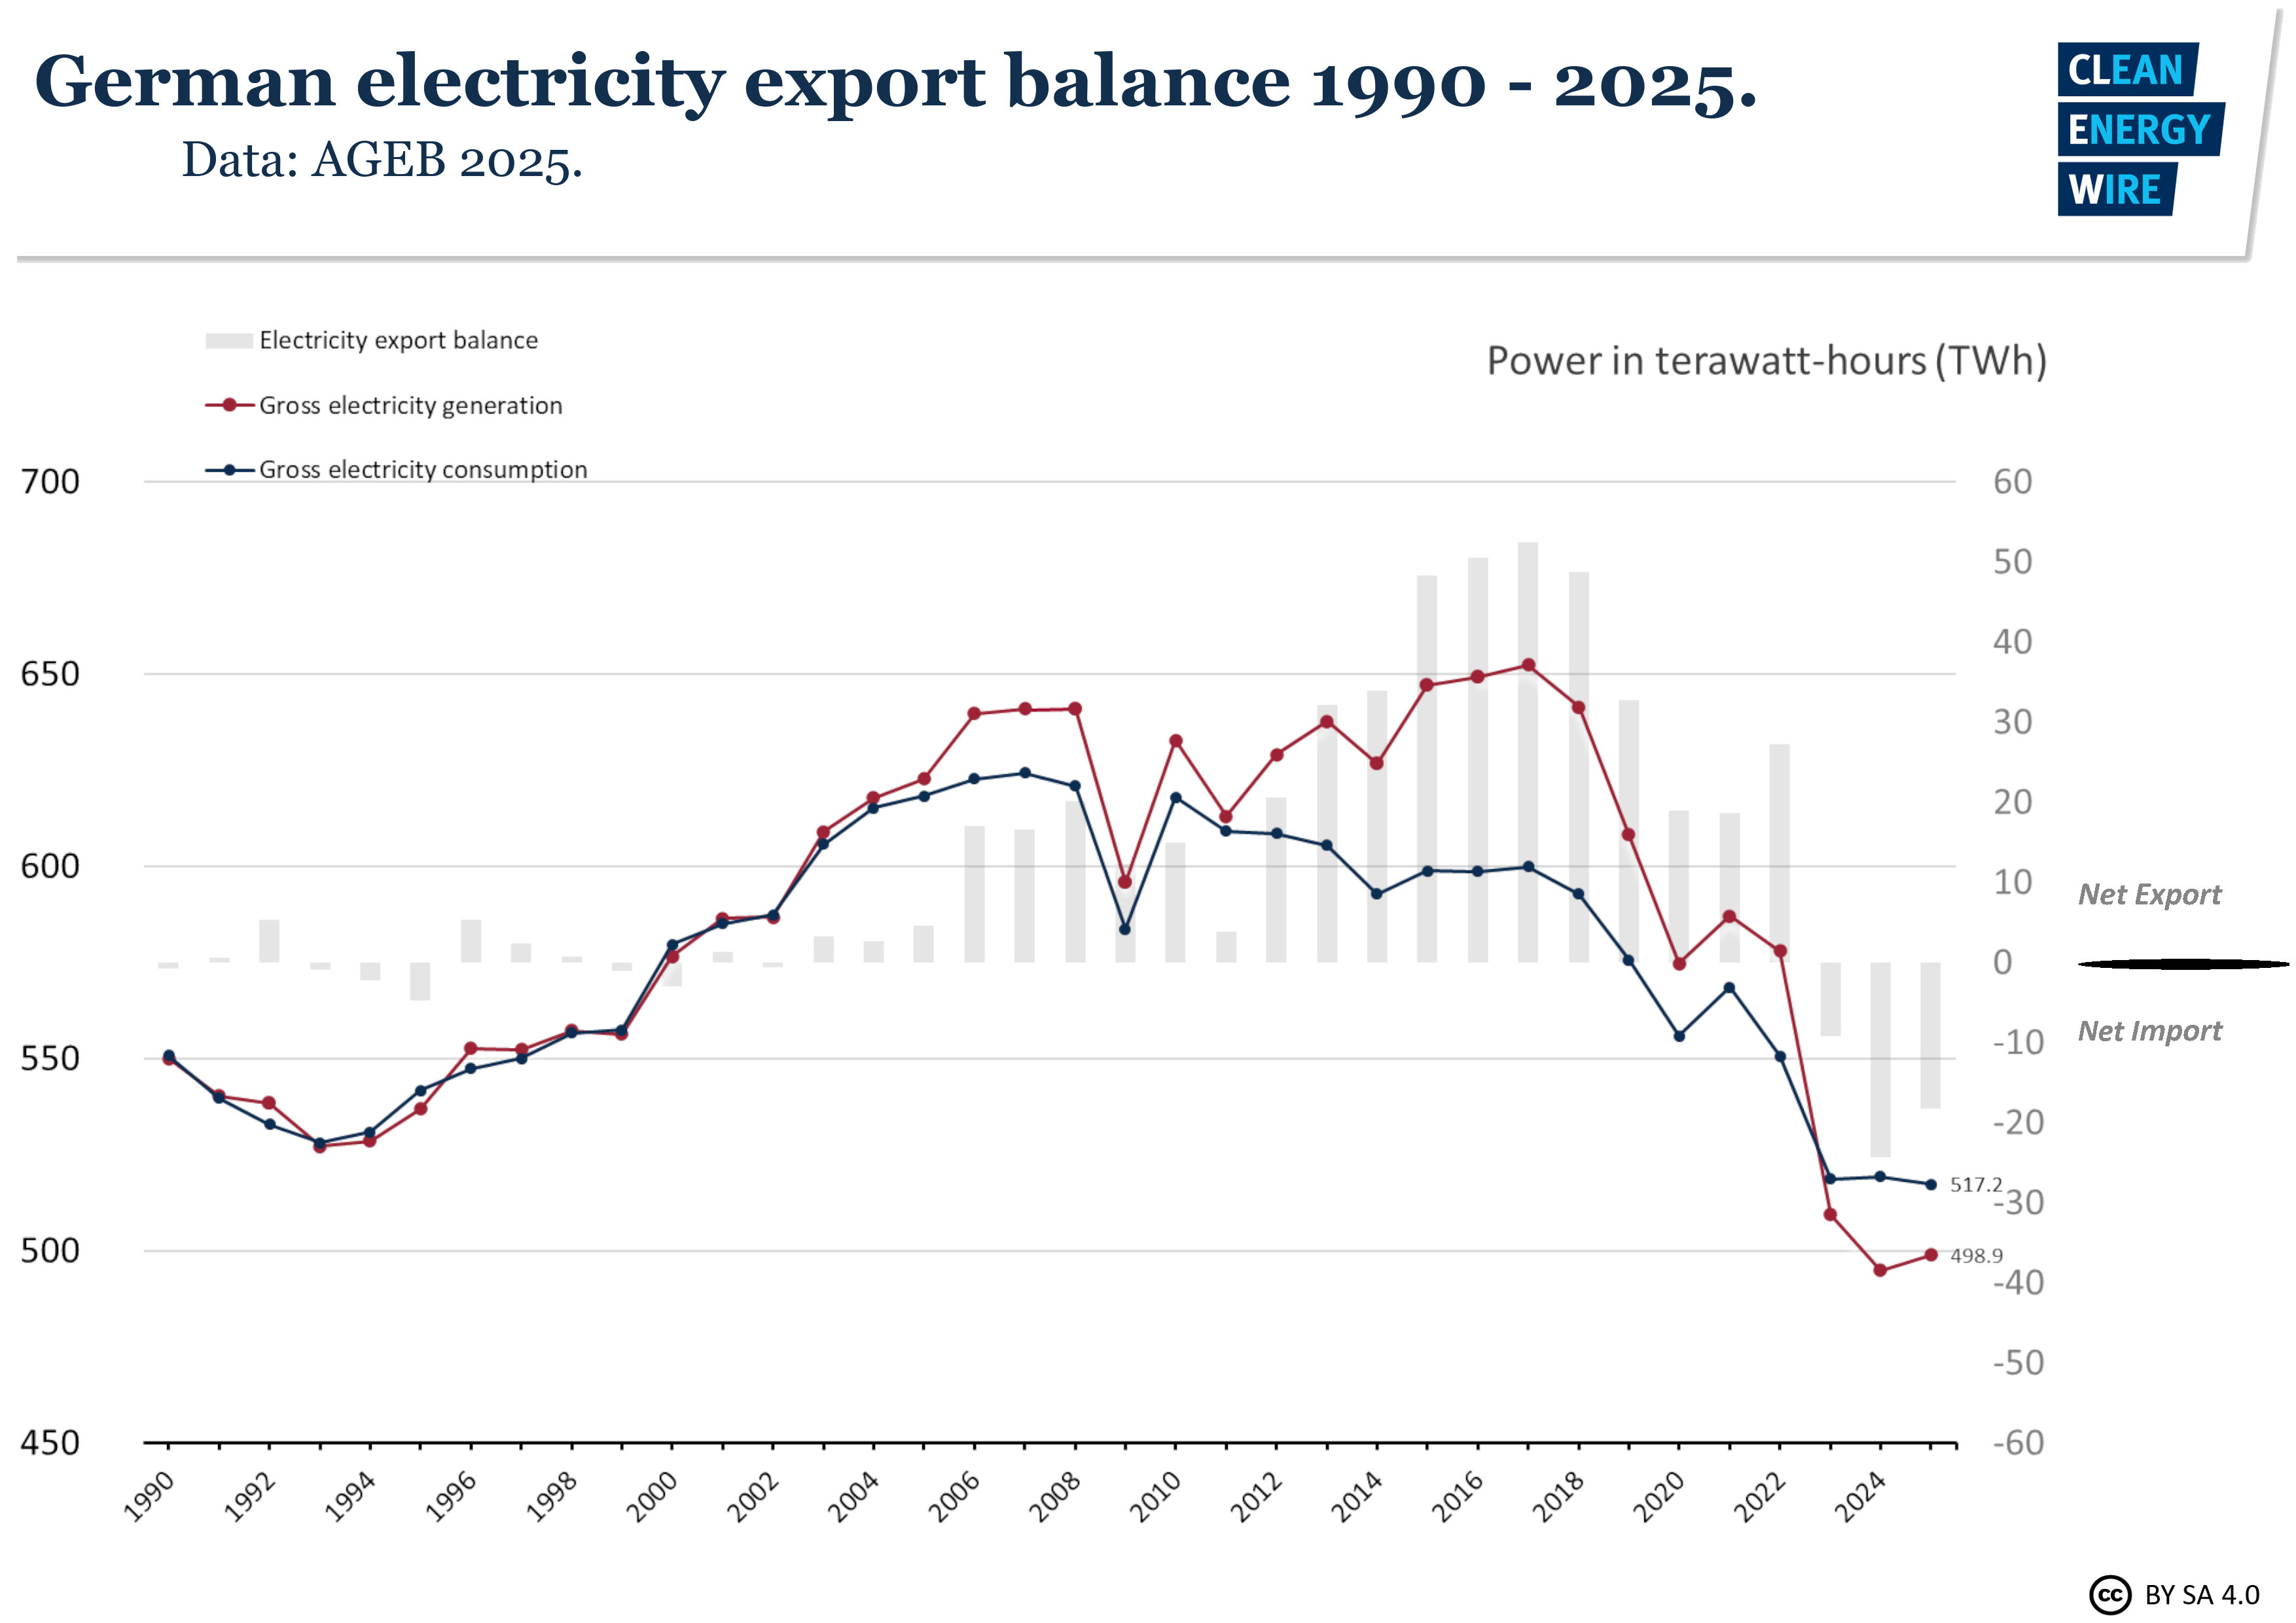
Link to source. Further data and graphs on Germany’s power imports and exports are available at the Energy Charts of the Fraunhofer ISE research institute.


Primary energy consumption (and gross final energy consumption)

Graph shows development of primary energy consumption in Germany 1990 - 2023. Graph: CLEW 2023.

Link to source here and here.

Graph shows German energy sources' share in primary energy consumption 1990 - 2023. Graph: CLEW 2023.

Link to source here and here.

Graph shows German energy sources' share in primary energy consumption 2023. Graph: CLEW 2023.

Link to source here and here.

Graph shows final energy consumption in Germany by consumer group 1990-2022. Graph: CLEW 2023.

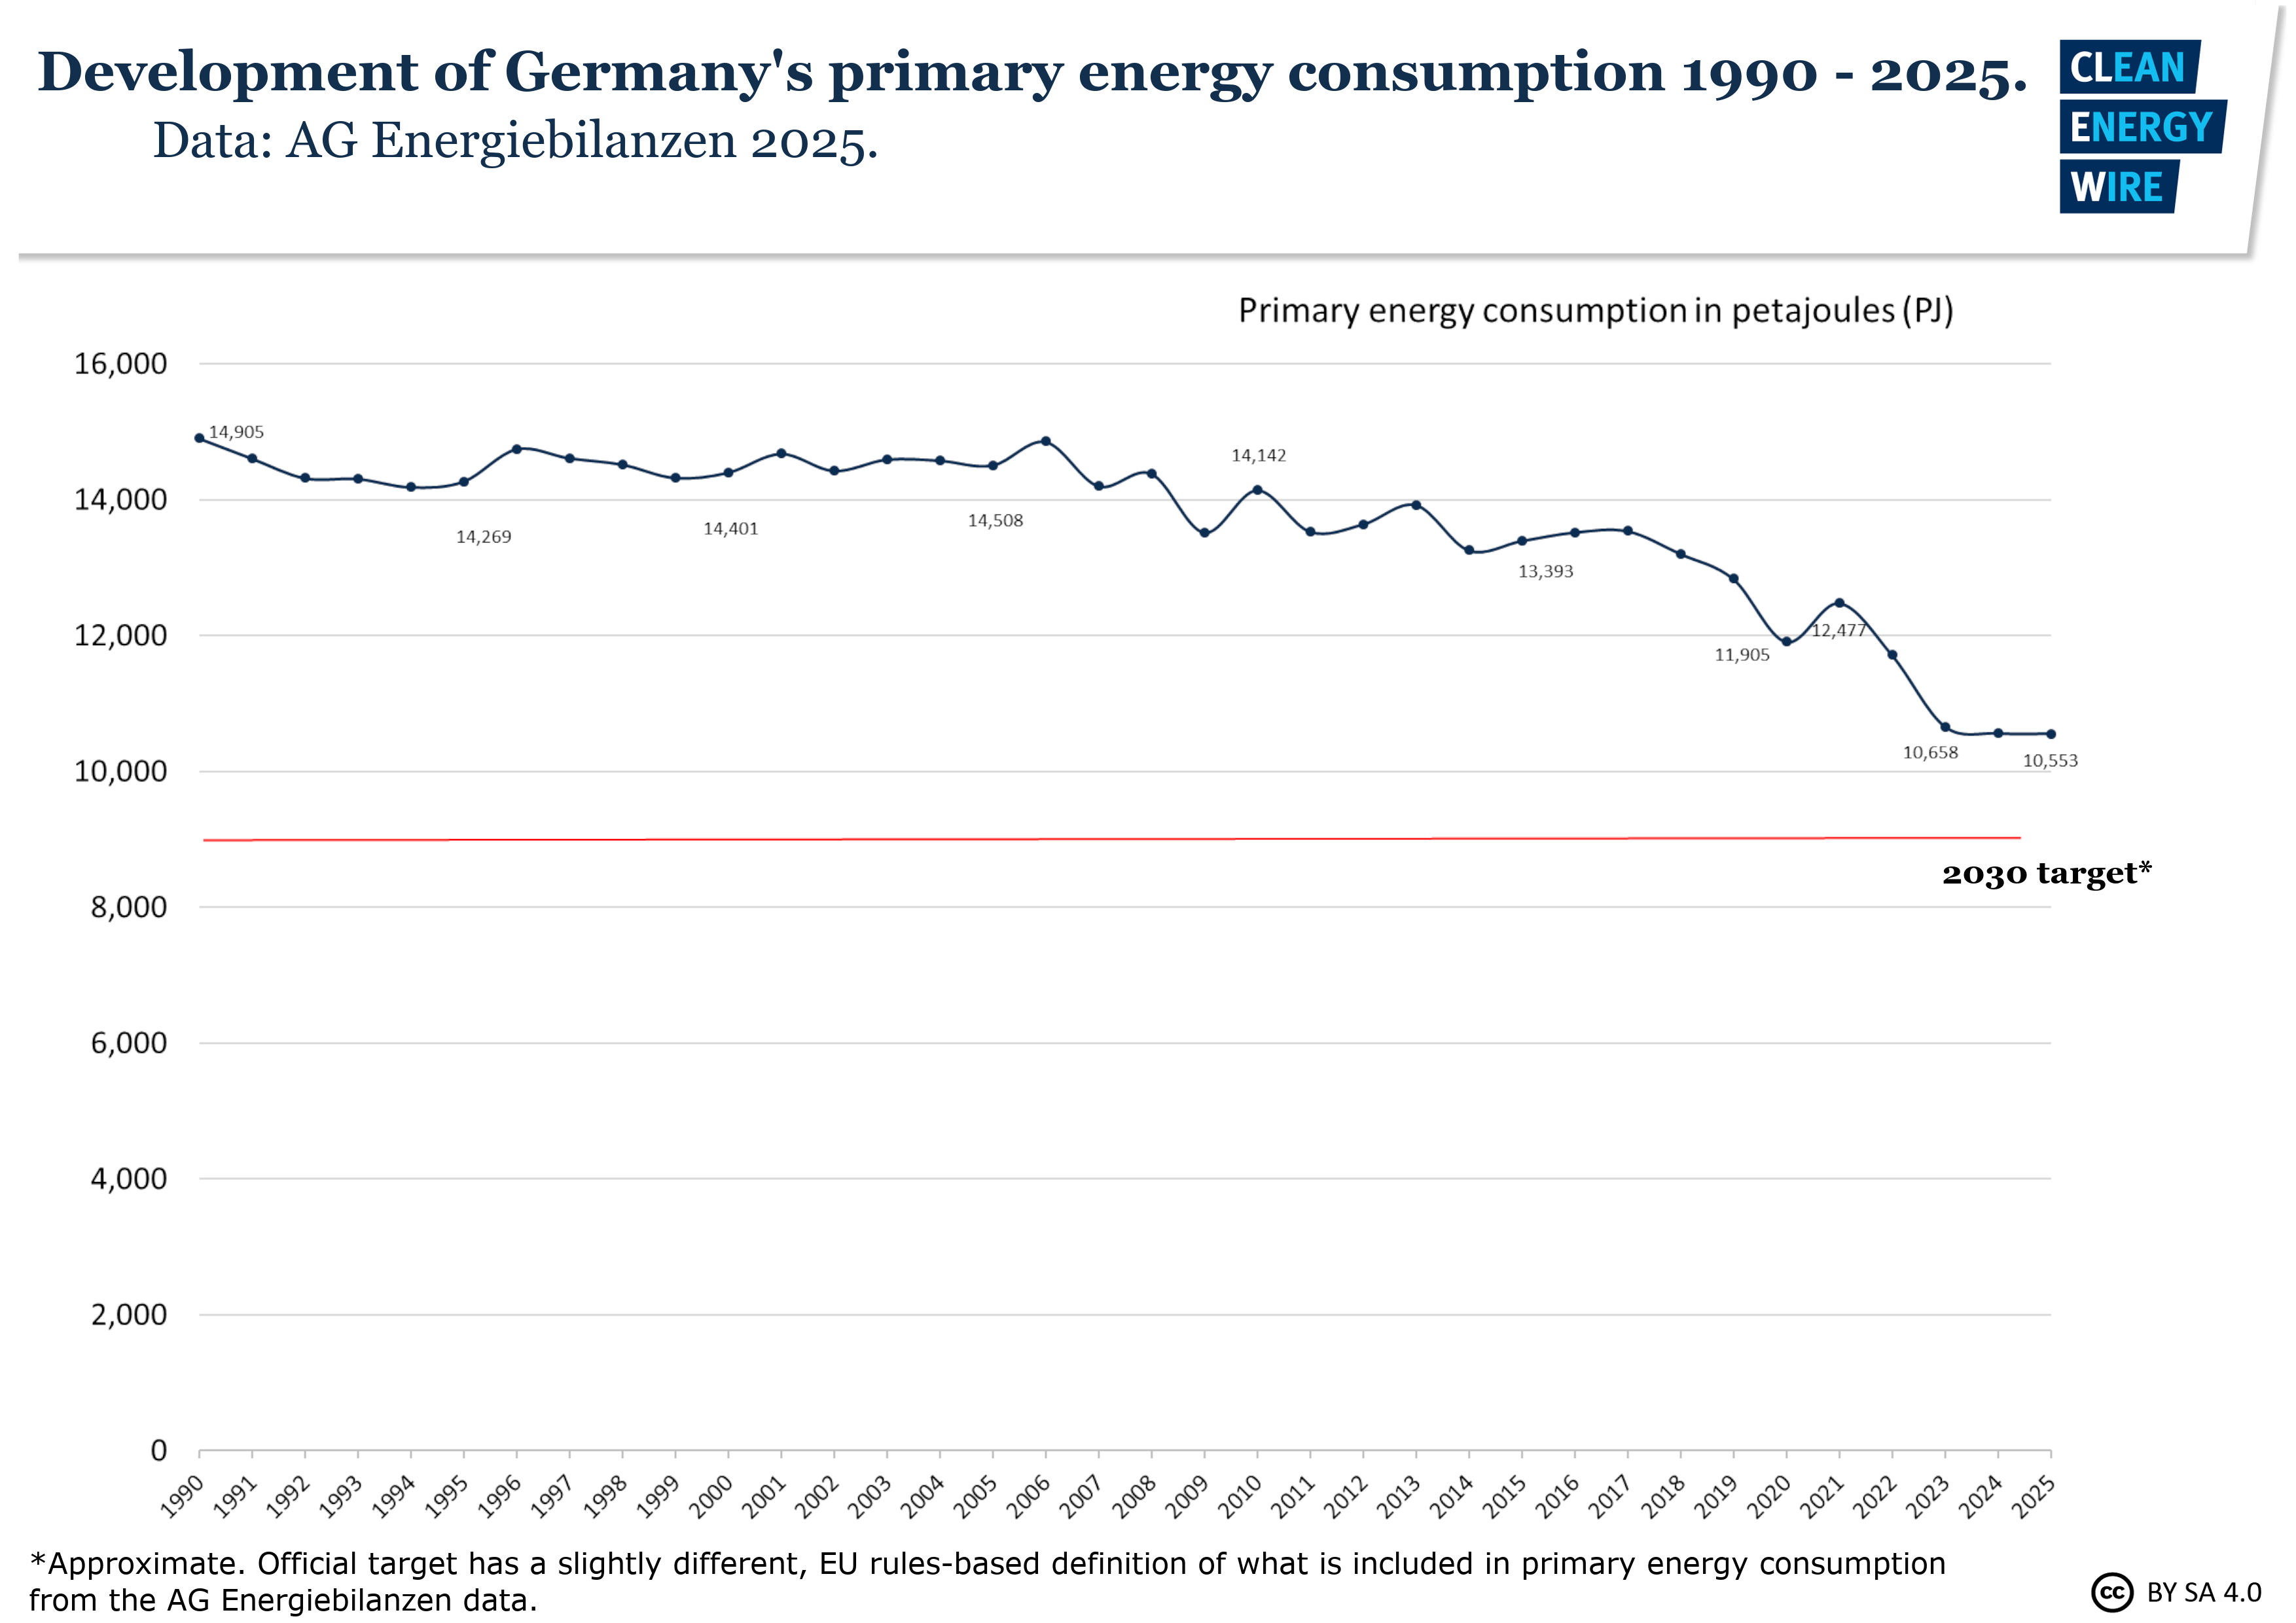
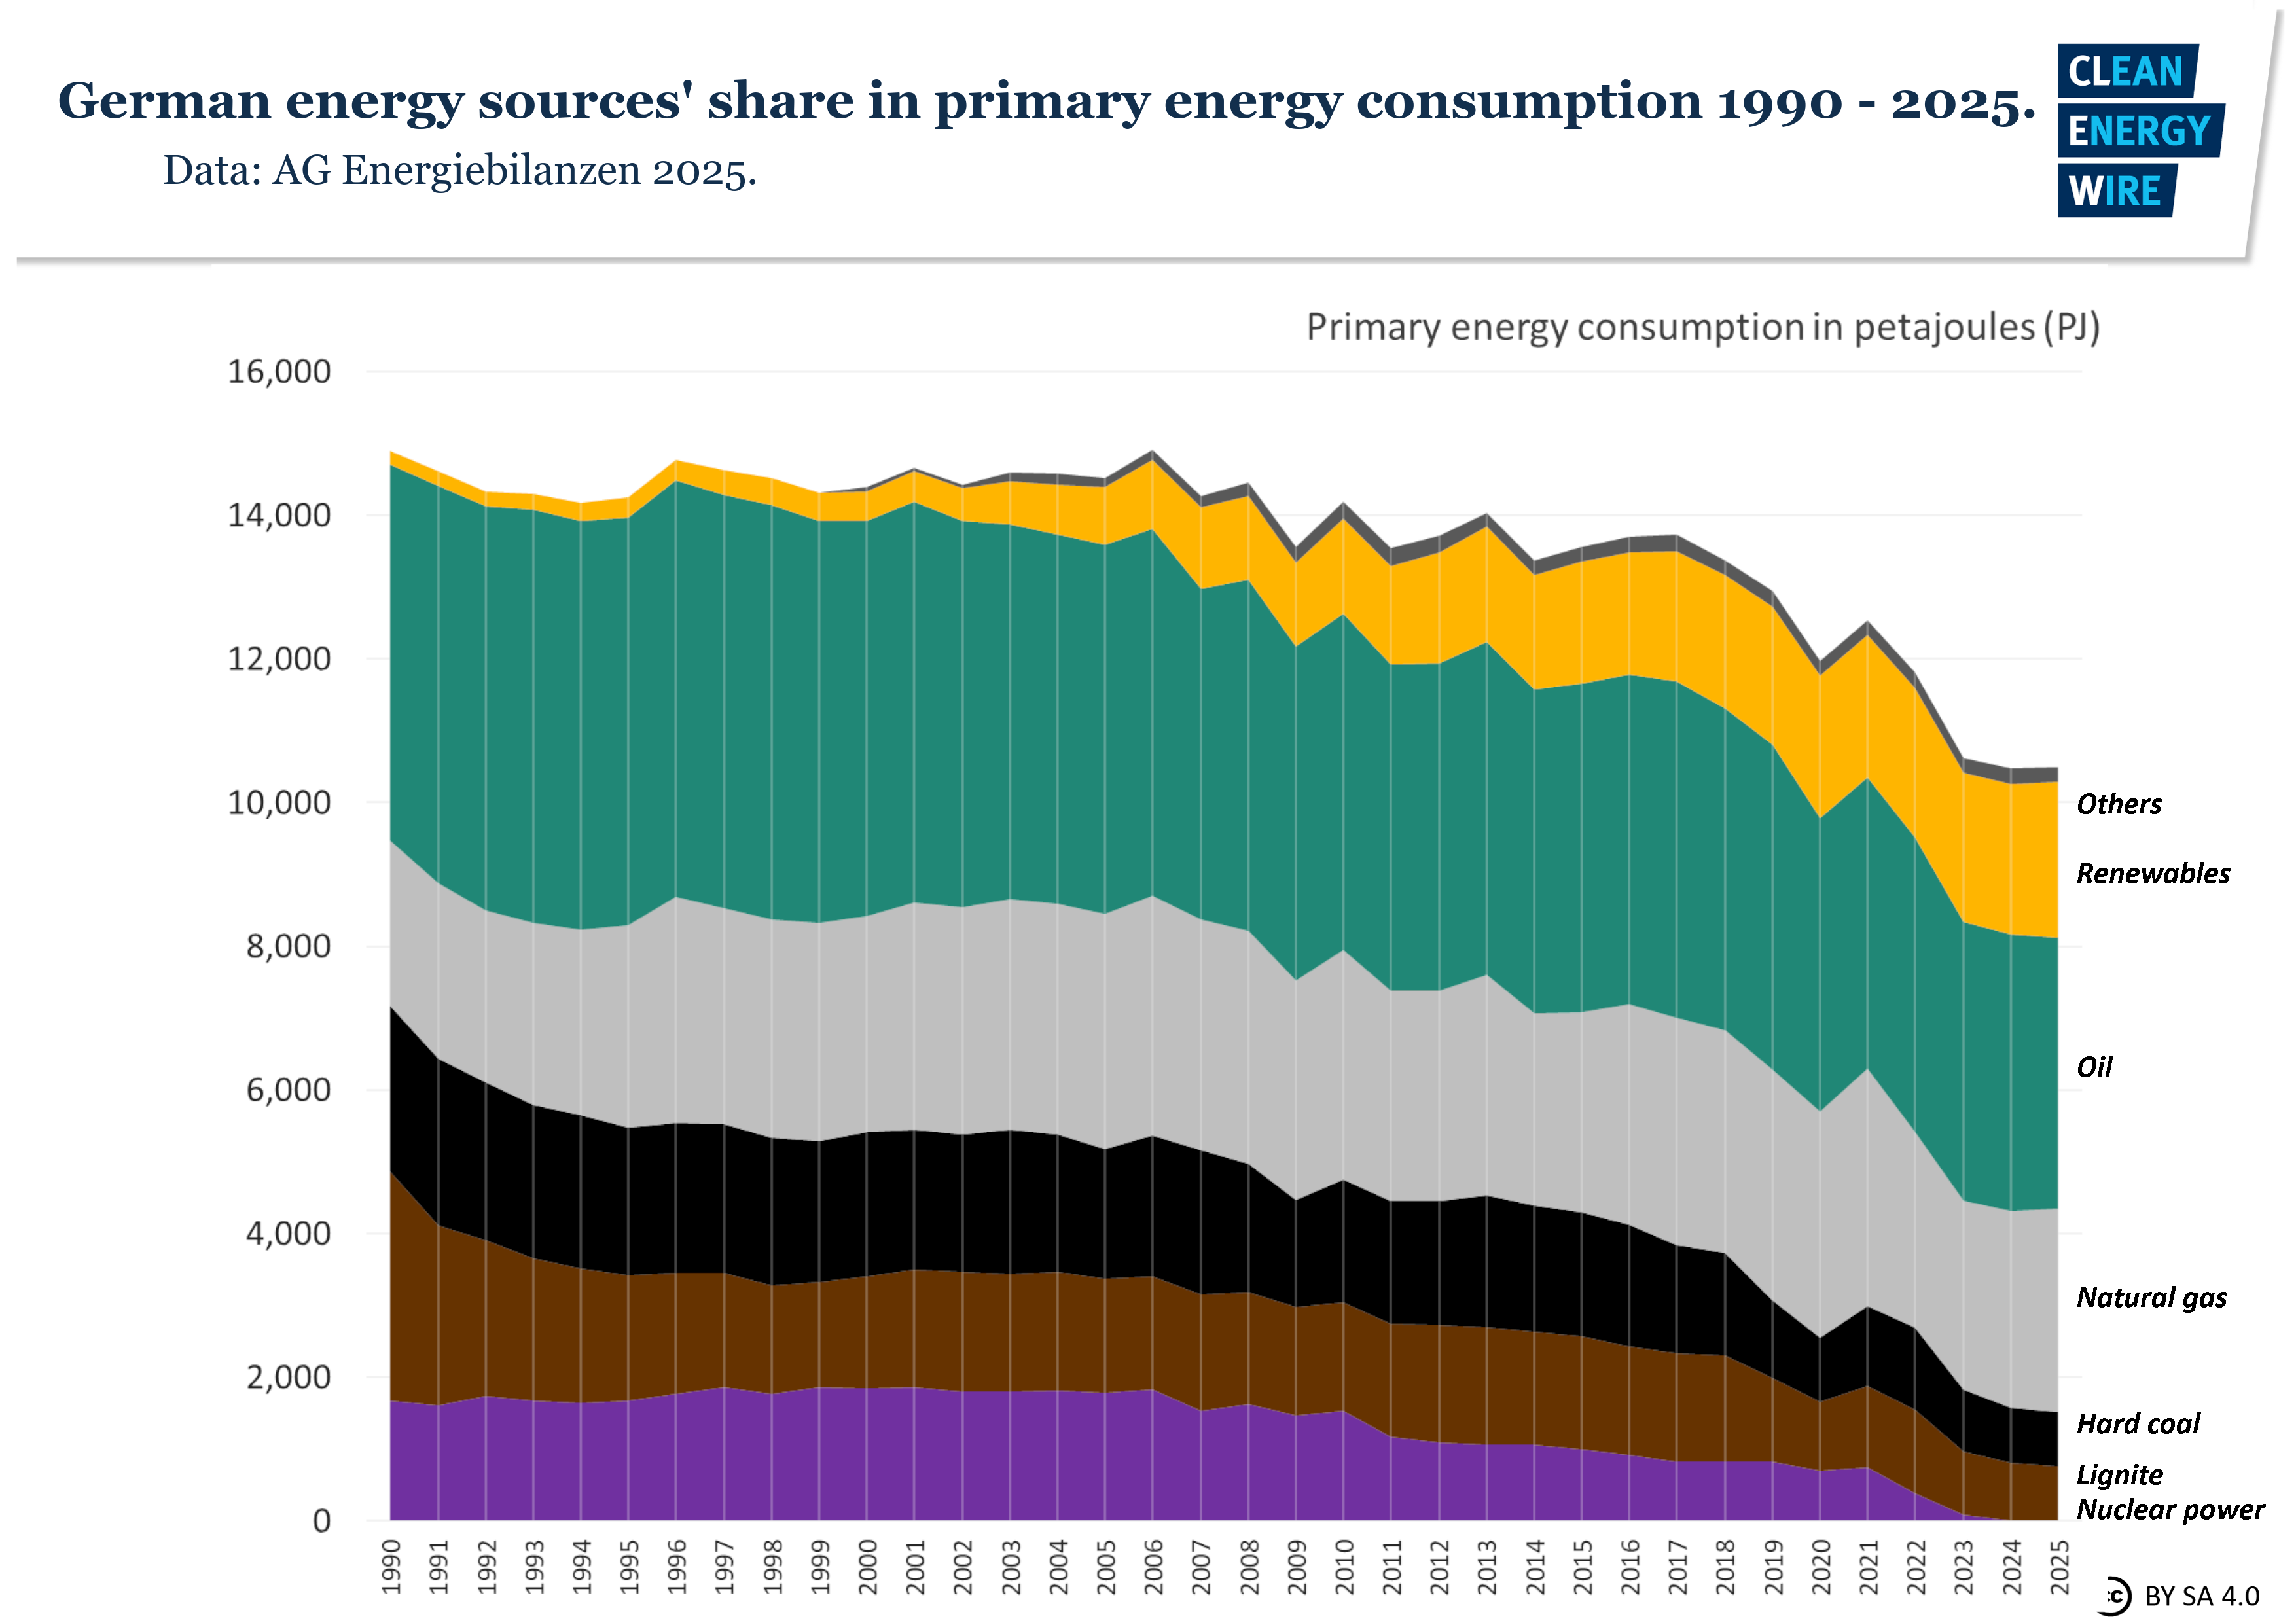
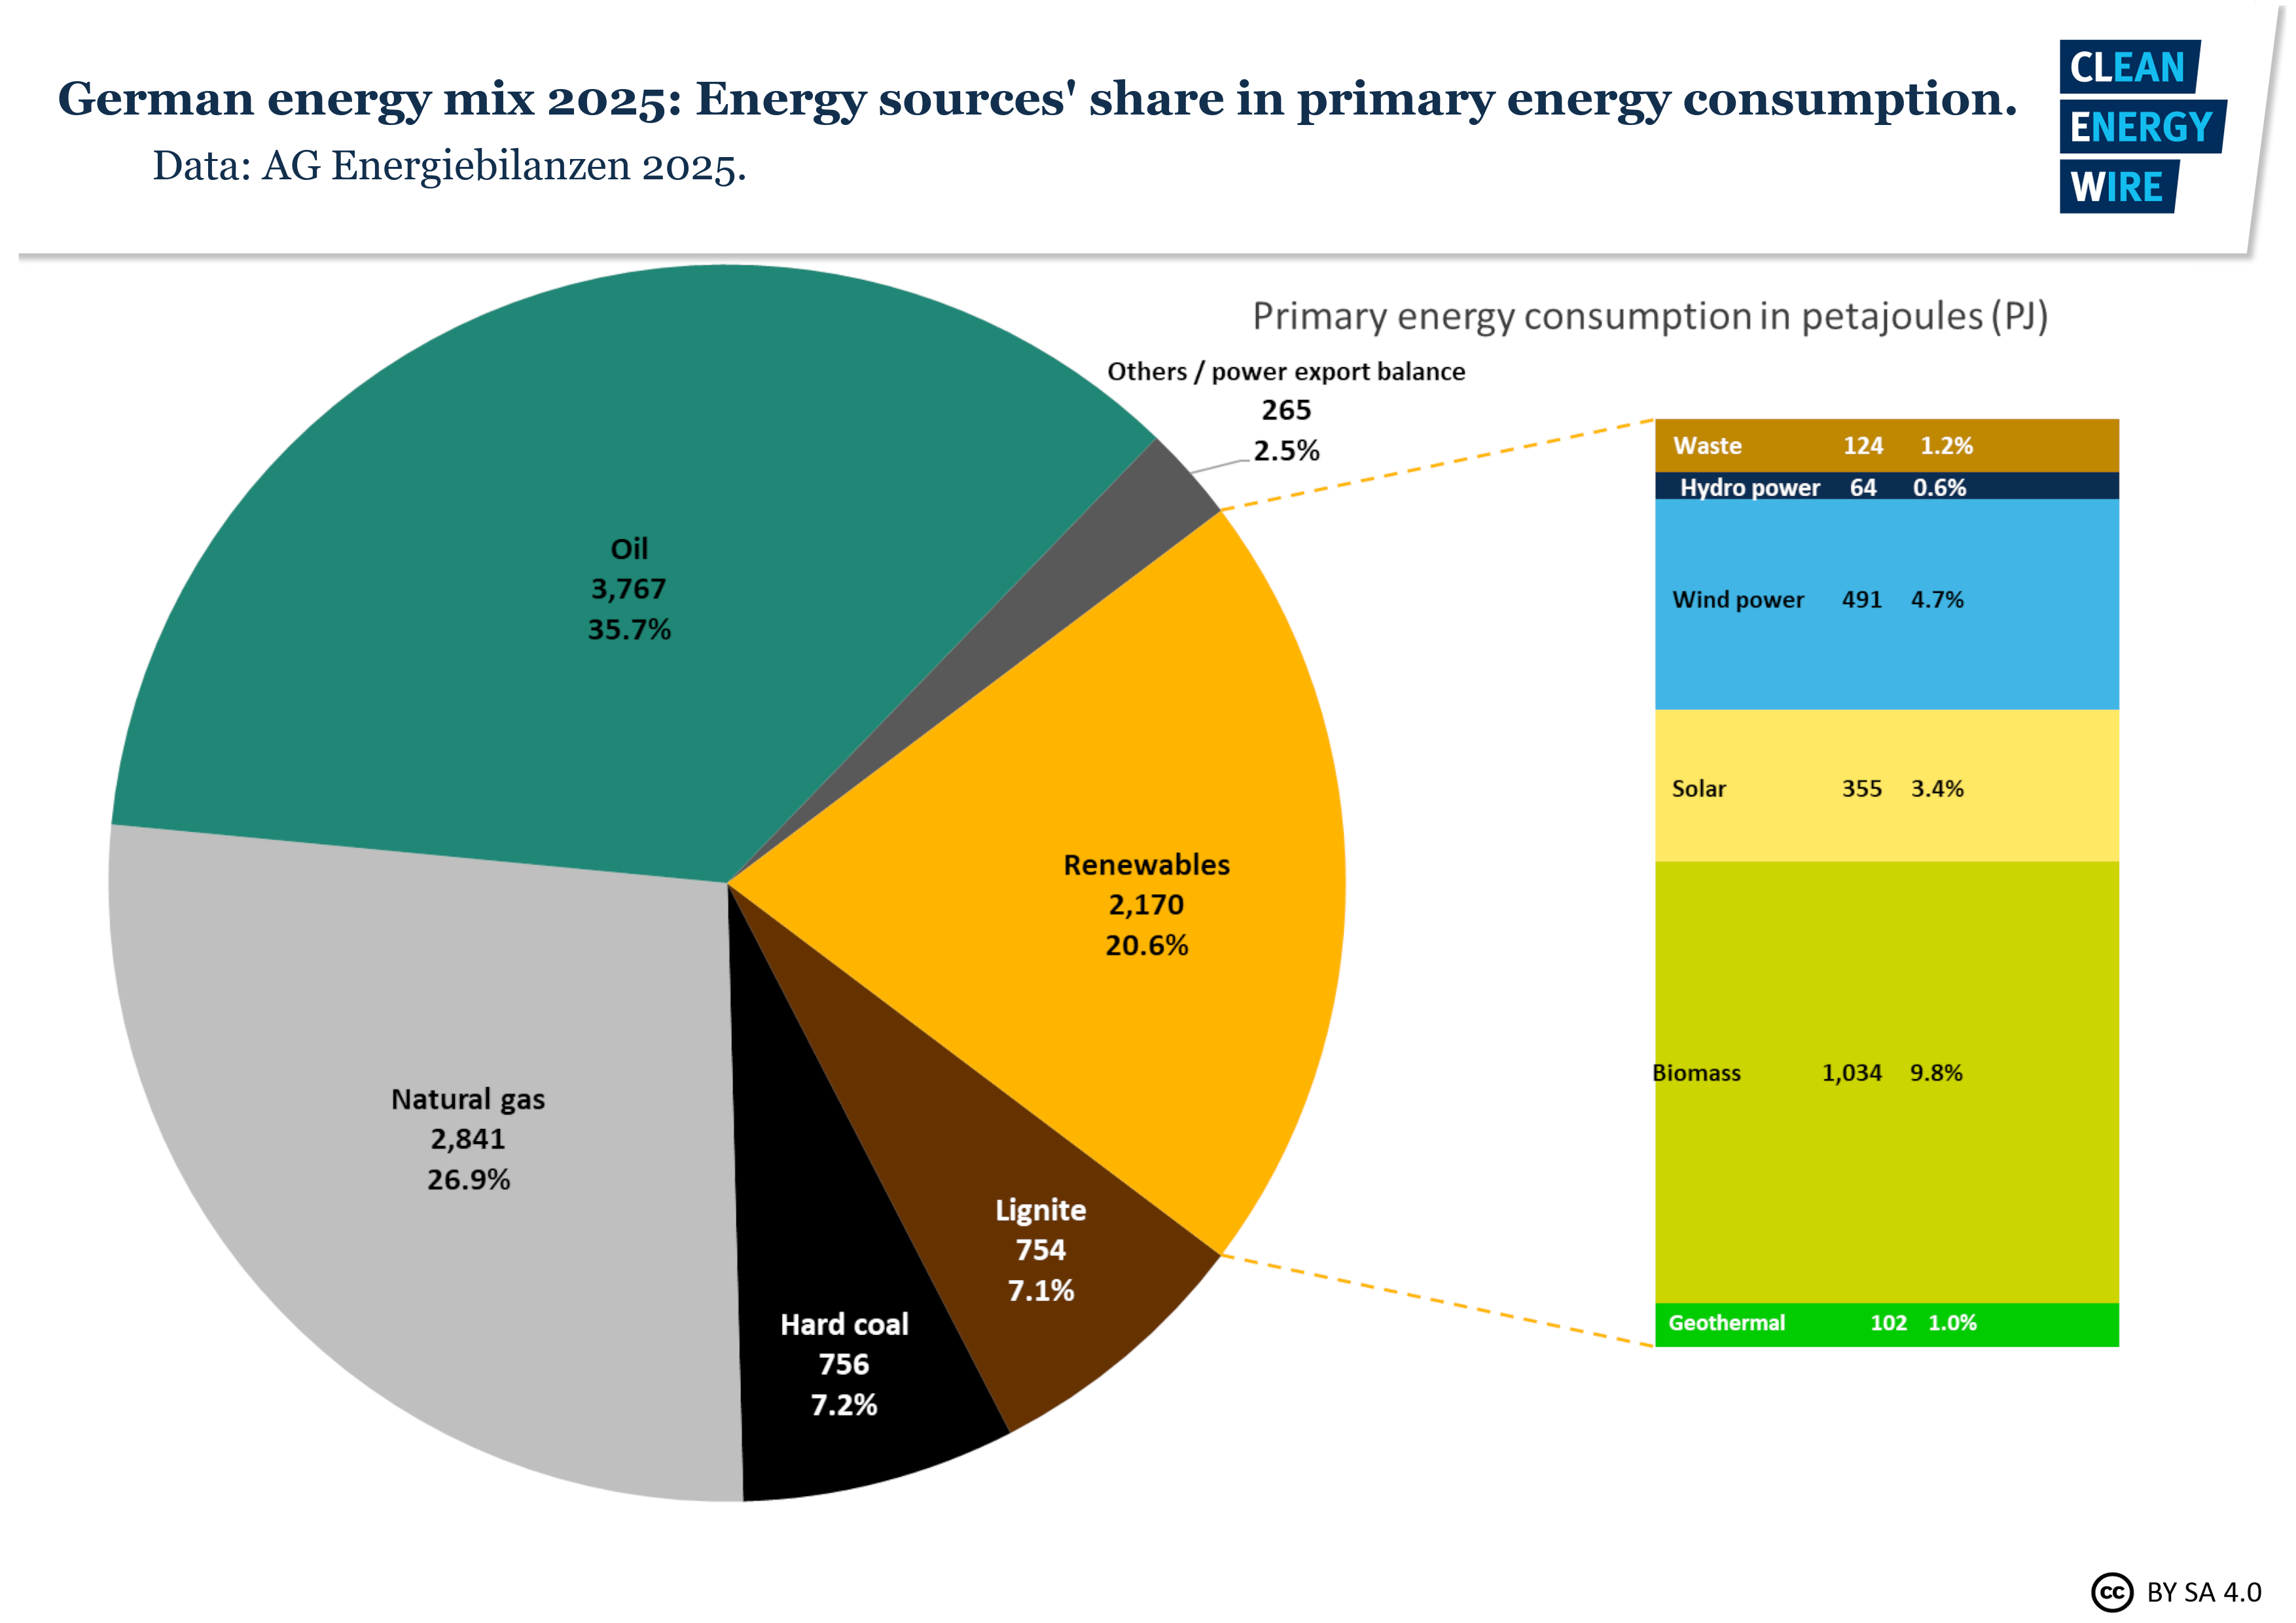
Link to source here.

Graph shows share of renewables in gross final energy consumption in Europe 2022. Graph: eurostat 2023.
All texts created by the Clean Energy Wire are available under a “Creative Commons Attribution 4.0 International Licence (CC BY 4.0)” . They can be copied, shared and made publicly accessible by users so long as they give appropriate credit, provide a link to the license, and indicate if changes were made.

Ask CLEW

Researching a story? Drop CLEW a line or give us a call for background material and contacts.

info@cleanenergywire.org

+49 30 62858 497

Journalism for the energy transition

Get our Newsletter
Join our Network
Find an interviewee