Renewables supplied 46% of net public power in Germany in 2021
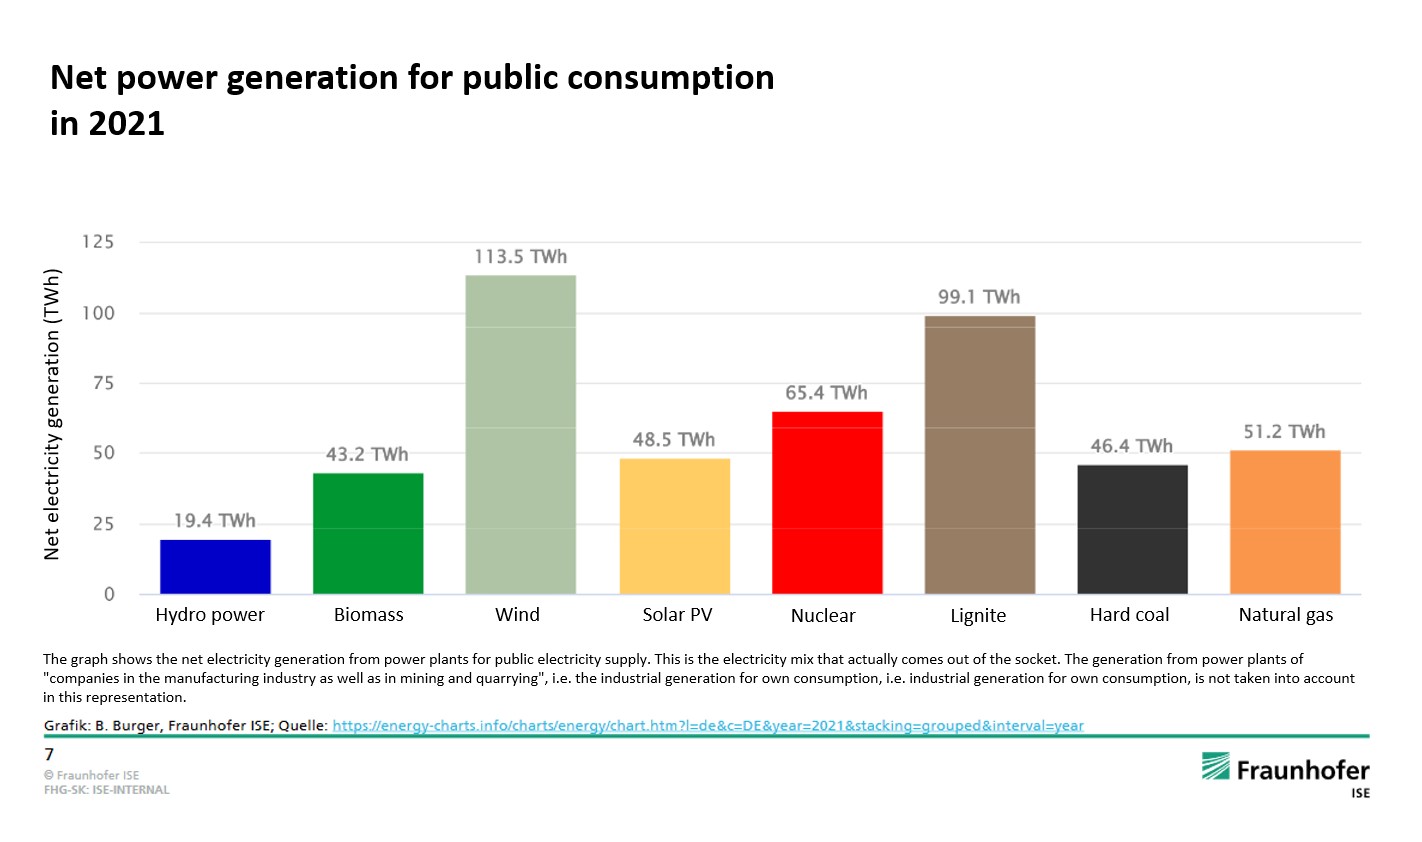
The share of renewables in net public power generation amounted to 46 percent in 2021, down from 50 percent the year before, figures released by research institute Fraunhofer ISE (Energy Charts) show. The reason for the decline in renewables share is lower wind energy production (minus 16.1 terawatt-hours (TWh)) than in 2020. Solar PV generation was up 0.7 TWh. “While 2020 was an above-average wind year, 2021 was rather below average,” Fraunhofer ISE writes. With a total of 113.5 TWh, wind power still contributed the largest share to the overall public power supply – which was slightly higher than the year before. However, when the wind didn’t blow strong enough, lignite-fired power plants mainly provided electricity during those hours, increasing their overall contribution to reach a share of 20.2 percent. The six remaining nuclear reactors had a share of 13.3 percent of public power supply. Gas-fired plants were often pushed out of the market, due to the sharp rise in natural gas prices and had a share of 10.4 percent. While solar PV and wind – Germany’s two main providers of renewable electricity – complement each other when seen on a monthly basis over one year, the Fraunhofer ISE noted that there will be more solar PV capacity necessary to provide a balanced supply.
Unlike other power mix data available, the Energy Charts specifically publish net public electricity generation, which Fraunhofer ISE says corresponds to the electricity mix that "comes out of the socket". In contrast to gross electricity generation, it does not take into account industry facilities, which are largely fired with conventional power sources like gas and coal, and the power plants' own consumption. The renewables share in gross power production in 2021 was 40.9 percent.
